Creating historical transparency for teams in IBM Watson Assistant with an Activity Log

Overview
My role:
Lead UX Designer on a team of 2 designers, 5 developers, and 1 product manager
Co-led design thinking workshop with product manager to create team alignment
Produced designs of varying fidelity using Figma and components of the IBM Carbon Design System
Worked collaboratively with developers to refine concepts for technical feasibility
Users:
Customers included ADP, Vodafone UK, CVS, Caixabank, Bradesco, CIBC, TD Bank
Product team focus at the time was on improvements for users working in teams
Techniques used:
Design thinking workshop and virtual collaboration with distributed team utilizing Mural, Figma, and WebEx
UI components sourced from IBM Carbon Design System
Timeframe:
2 months from workshop to design delivery, 1 year to general release
Challenges:
Net new page in product with complex data filtering created technical issues on the back end of development. Decisions needed to be made regarding which items would be tracked and how to label them appropriately. This delayed feature release for several months.
Some features we thought would be easy to achieve, i.e. showing an avatar on the table for each user, were not allowed because of privacy permissions in the product.
Initial designs were more focused on tracking the activities by user, which used a notification style format; however, we changed the focus to tracking changes in the product, with the user being secondary to that, which required a data table format instead.
Understanding the Problem Space
Meet our user, Tanya

Tanya is a conversation designer and subject matter expert (SME) at an enterprise-level company.
She works as part of a team of conversation designers within a large business unit using Watson Assistant to build and deploy AI Assistants on the company website.
Tanya’s Problem:
Tanya is concerned that when her assistant isn’t working properly, she doesn’t know when the problem occurred or who to contact to resolve it.
Tanya needs more transparency and details about the changes being made to her assistant, as she is one of several SMEs contributing to the same assistant.
Discovery
Workshop with the squad
We used a combination of customer calls and design thinking workshops to determine what information our users needed in this solution.
At the time, our product team was focused on how teams of “Tanyas” were using Watson Assistant, and how we might improve that experience.
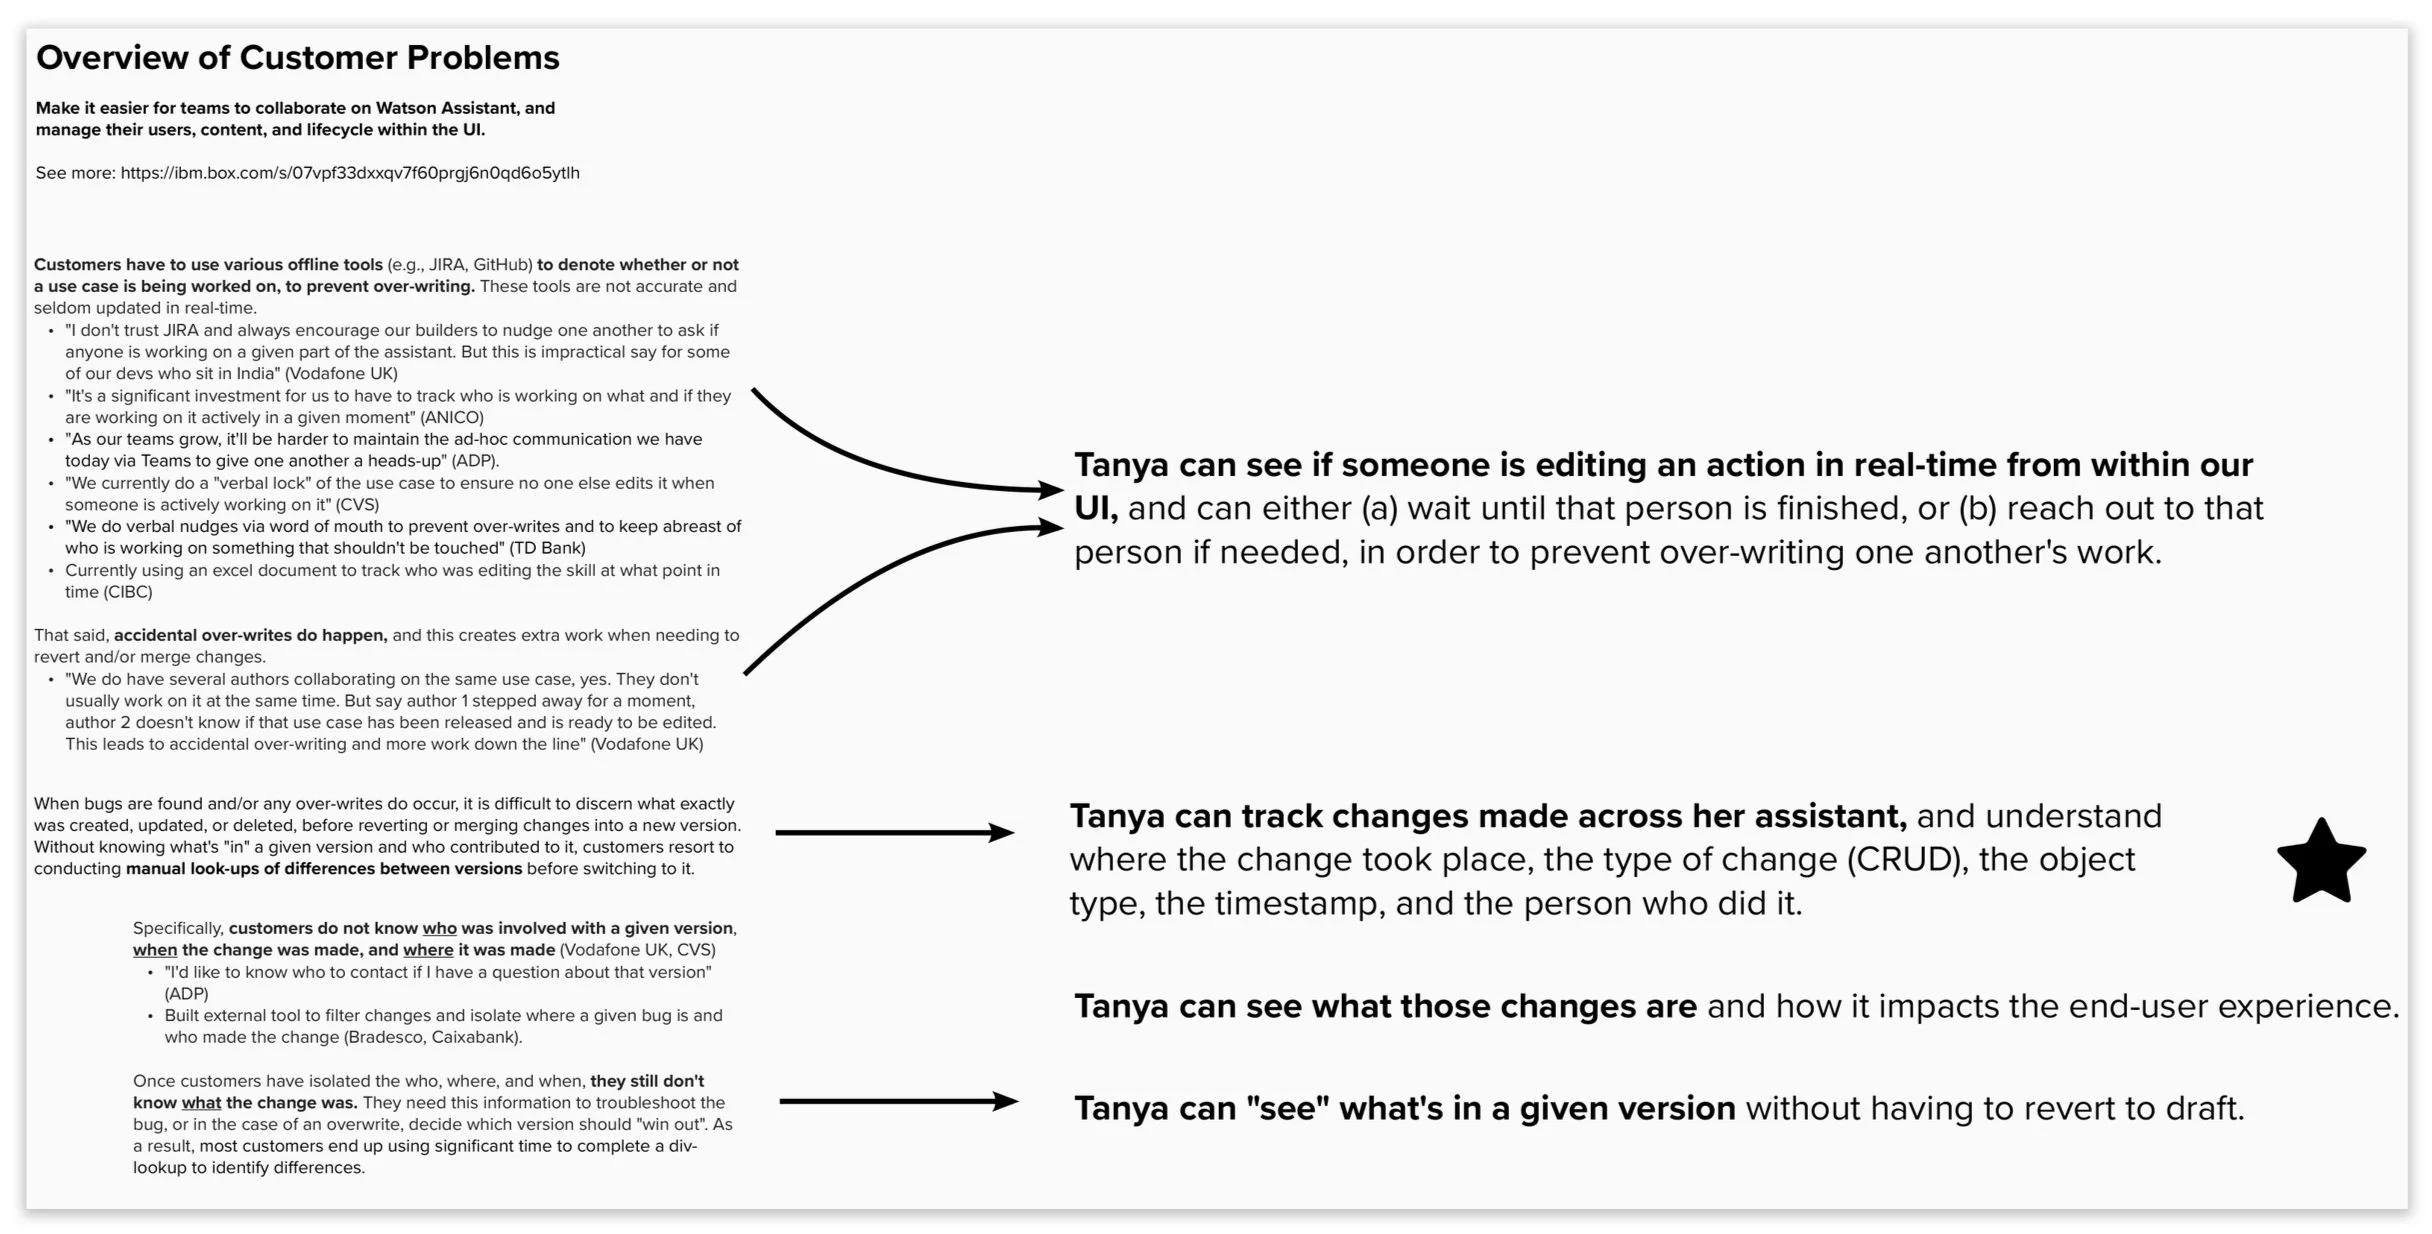
There were a few different paths we thought we could pursue based on customer feedback. (see below)
Ultimately, we decided that an activity tracking tool would solve the most customer issues with the least effort.
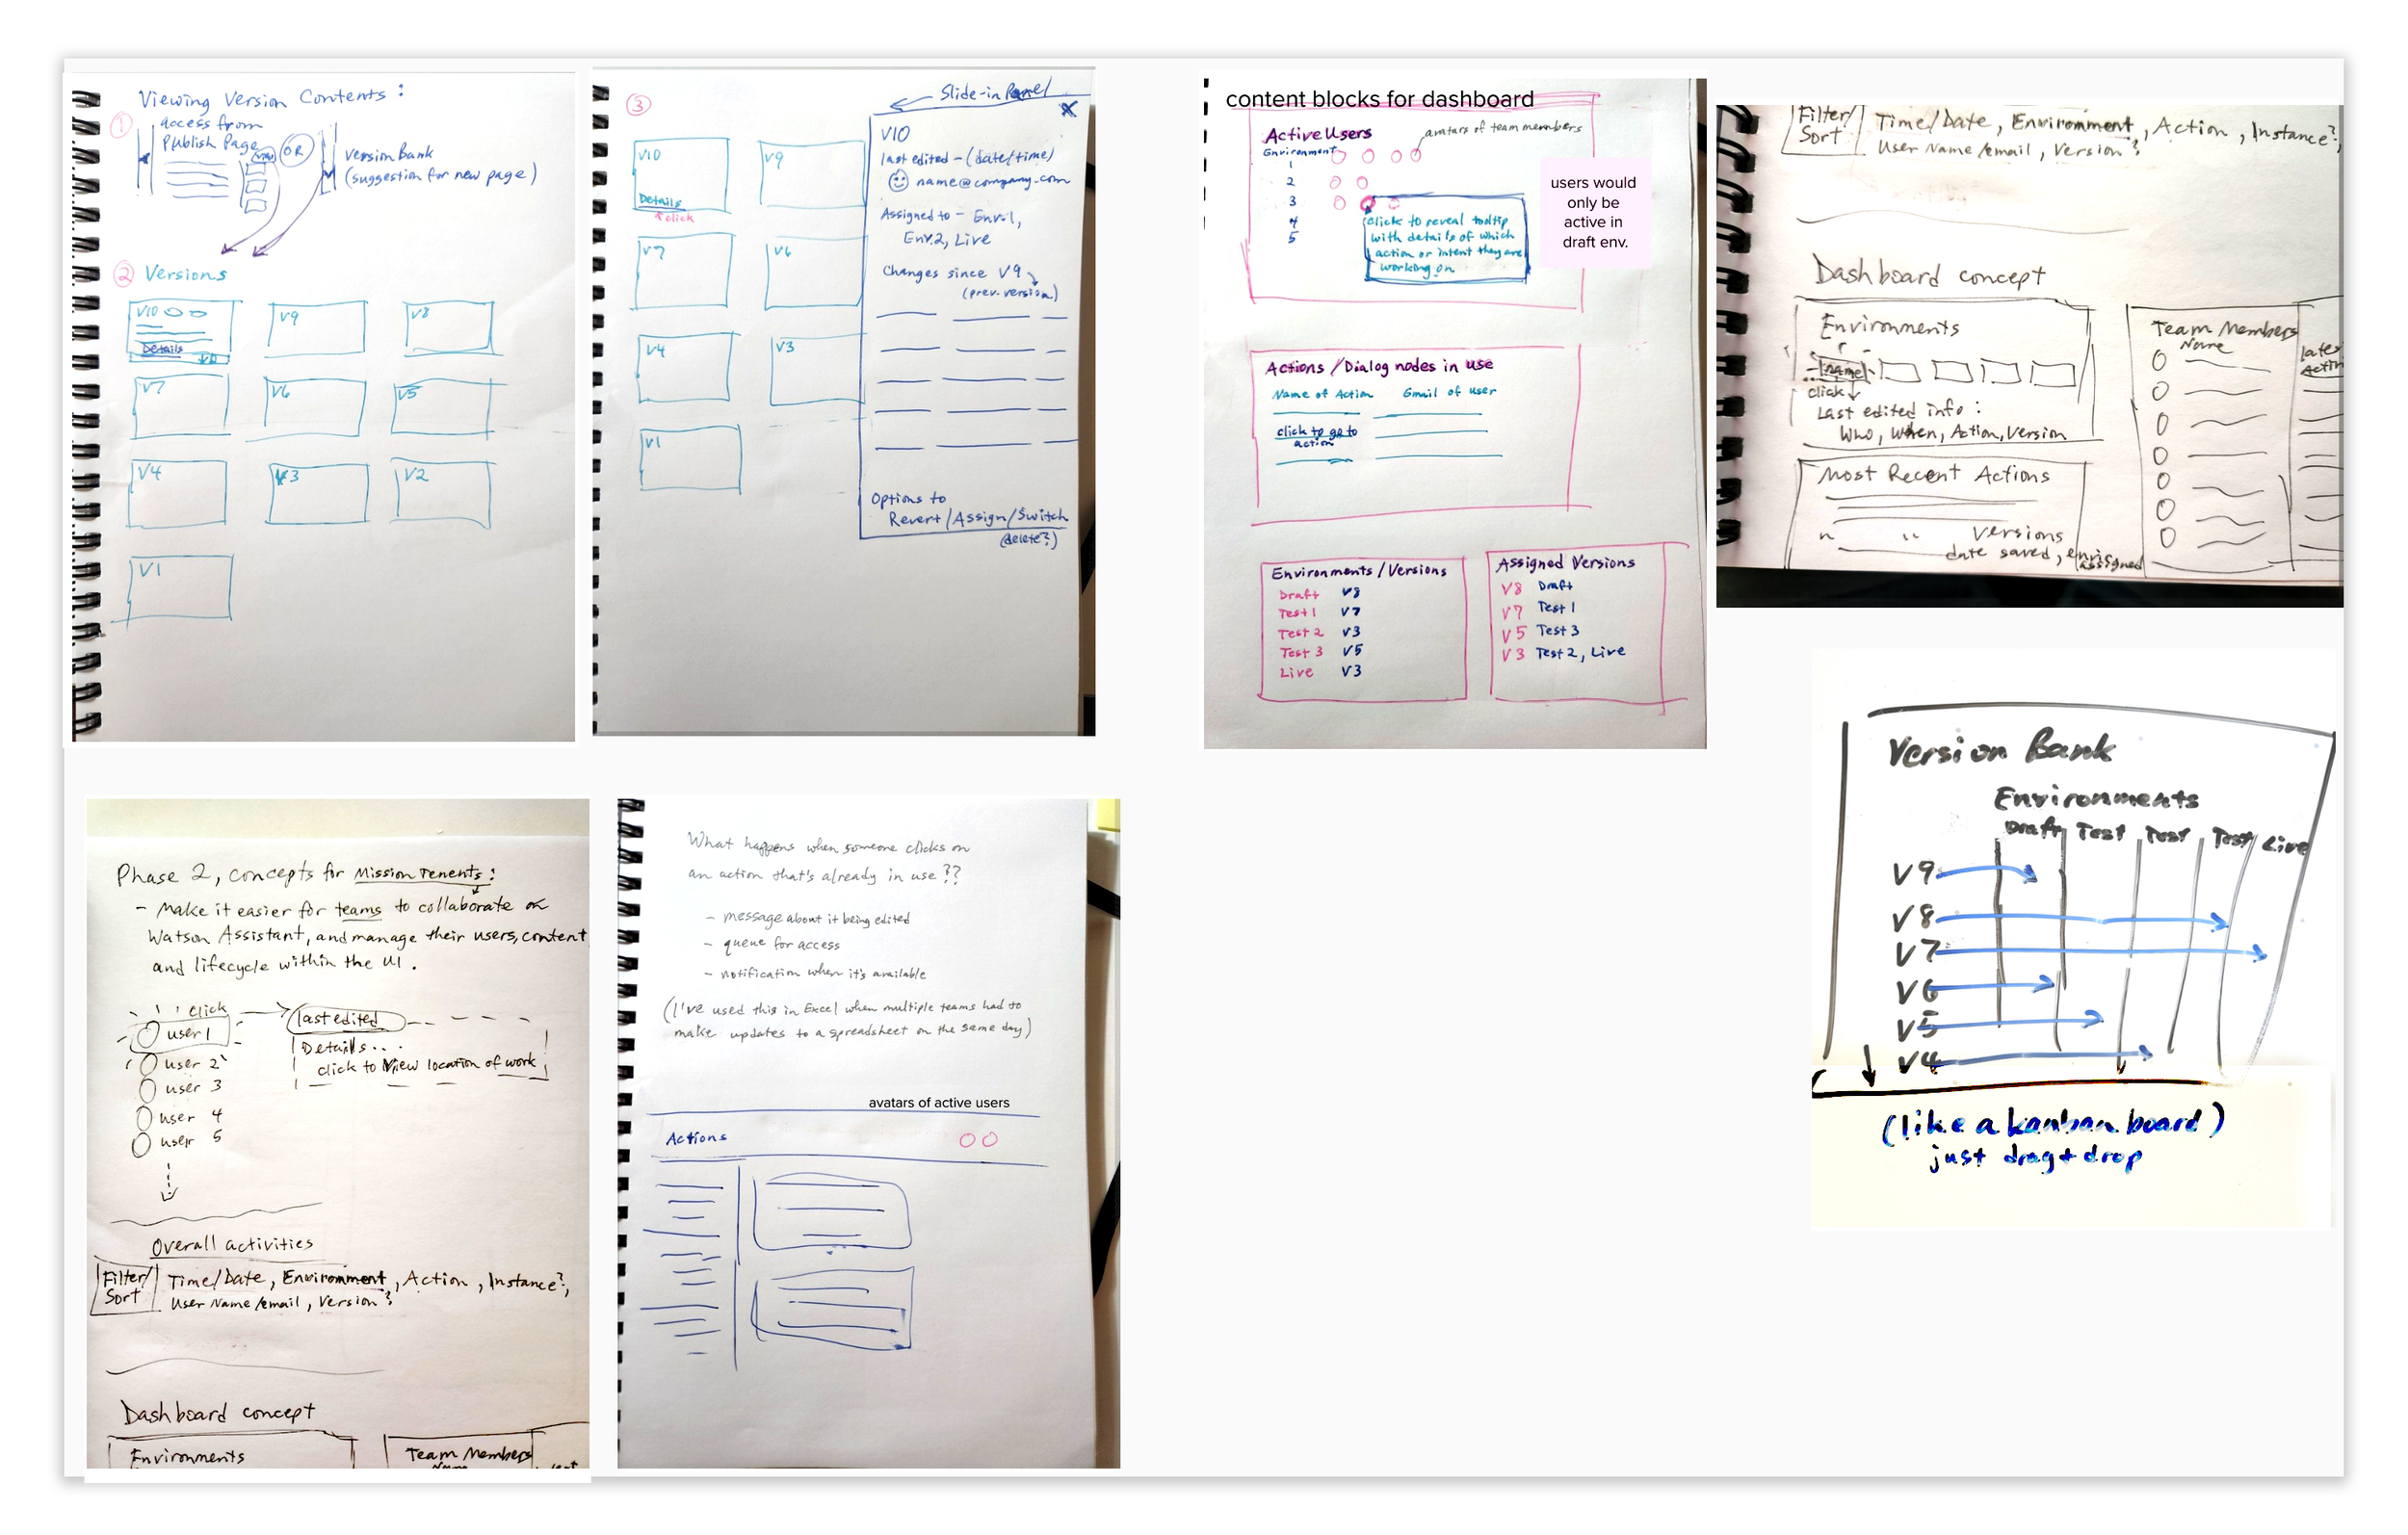
Everyone on the team contributed concepts to the workshop. See below for mine:
Design
Iteration 1
Initial designs for activity tracking were centered on user activity, and took the form of a notifications panel. Inspiration was taken from other internal IBM apps.
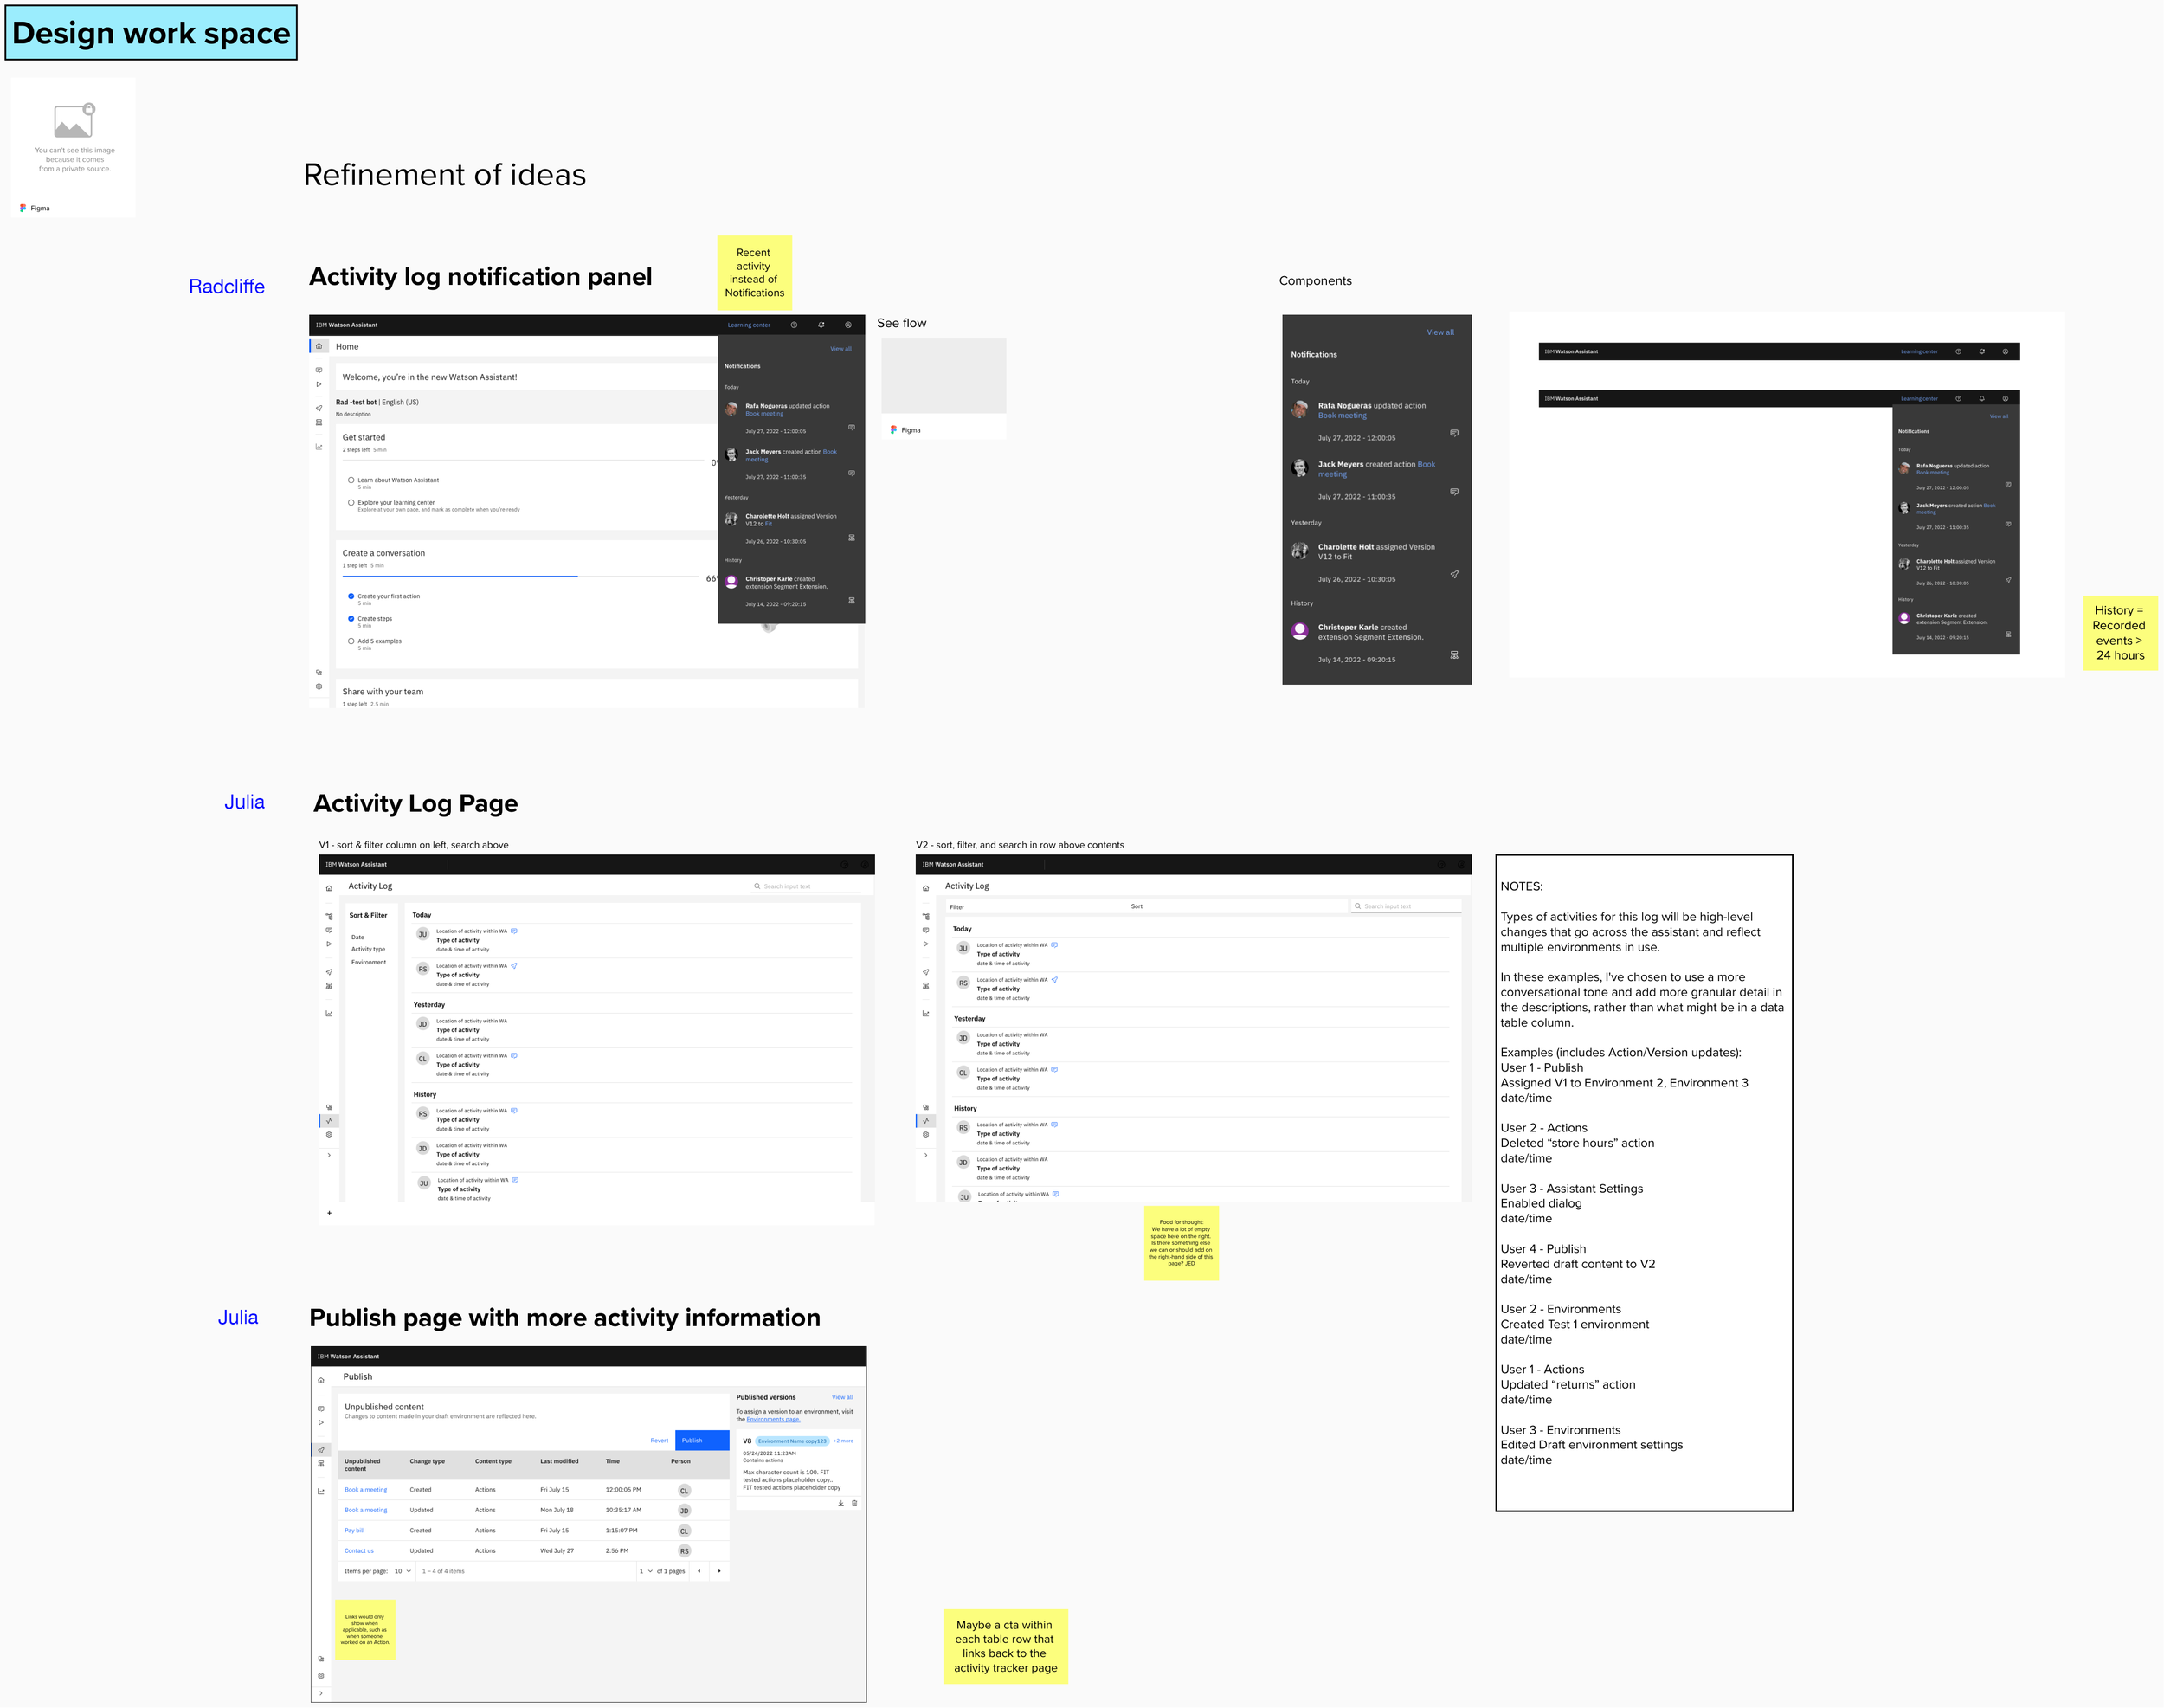
Iteration 2
After presenting our first concepts to the rest of the squad, the team decided to pivot to a data table which would be easier for an admin to sort, filter, and see more data at one time. This was due to the number of changes that are made in an assistant over time. Our first concepts wouldn’t scale appropriately for our user’s needs.
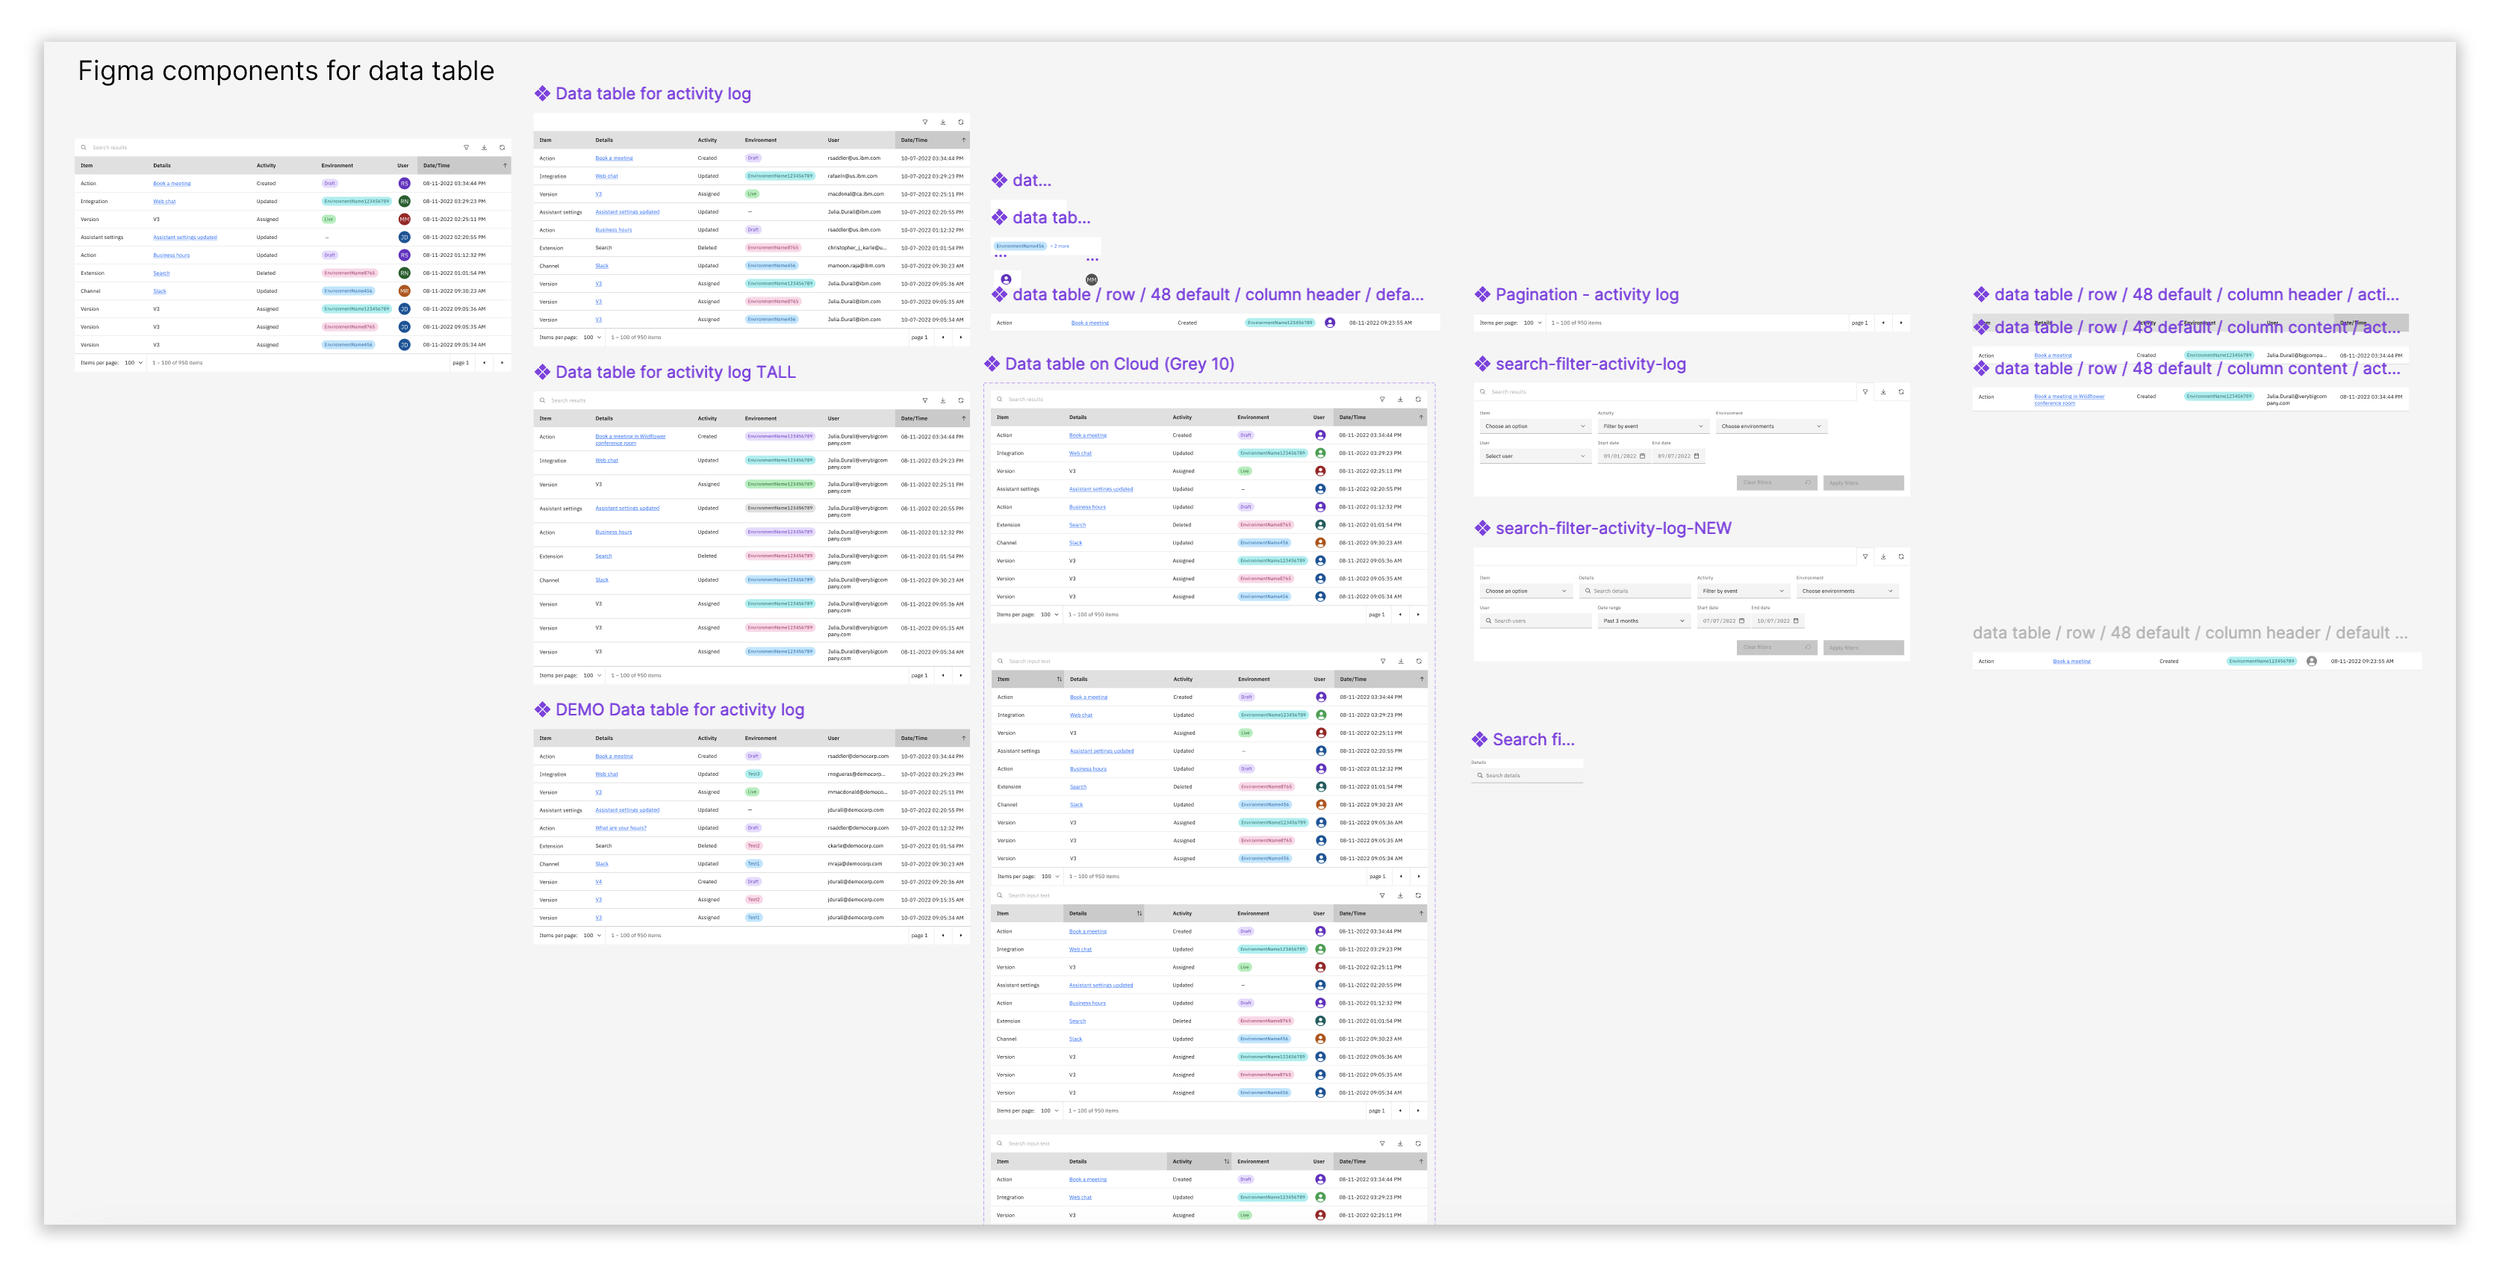
Although we have a data table component in the IBM Carbon Design System, this table had some unique fields which required more customization. Here are some of the Figma components I built for the prototype.
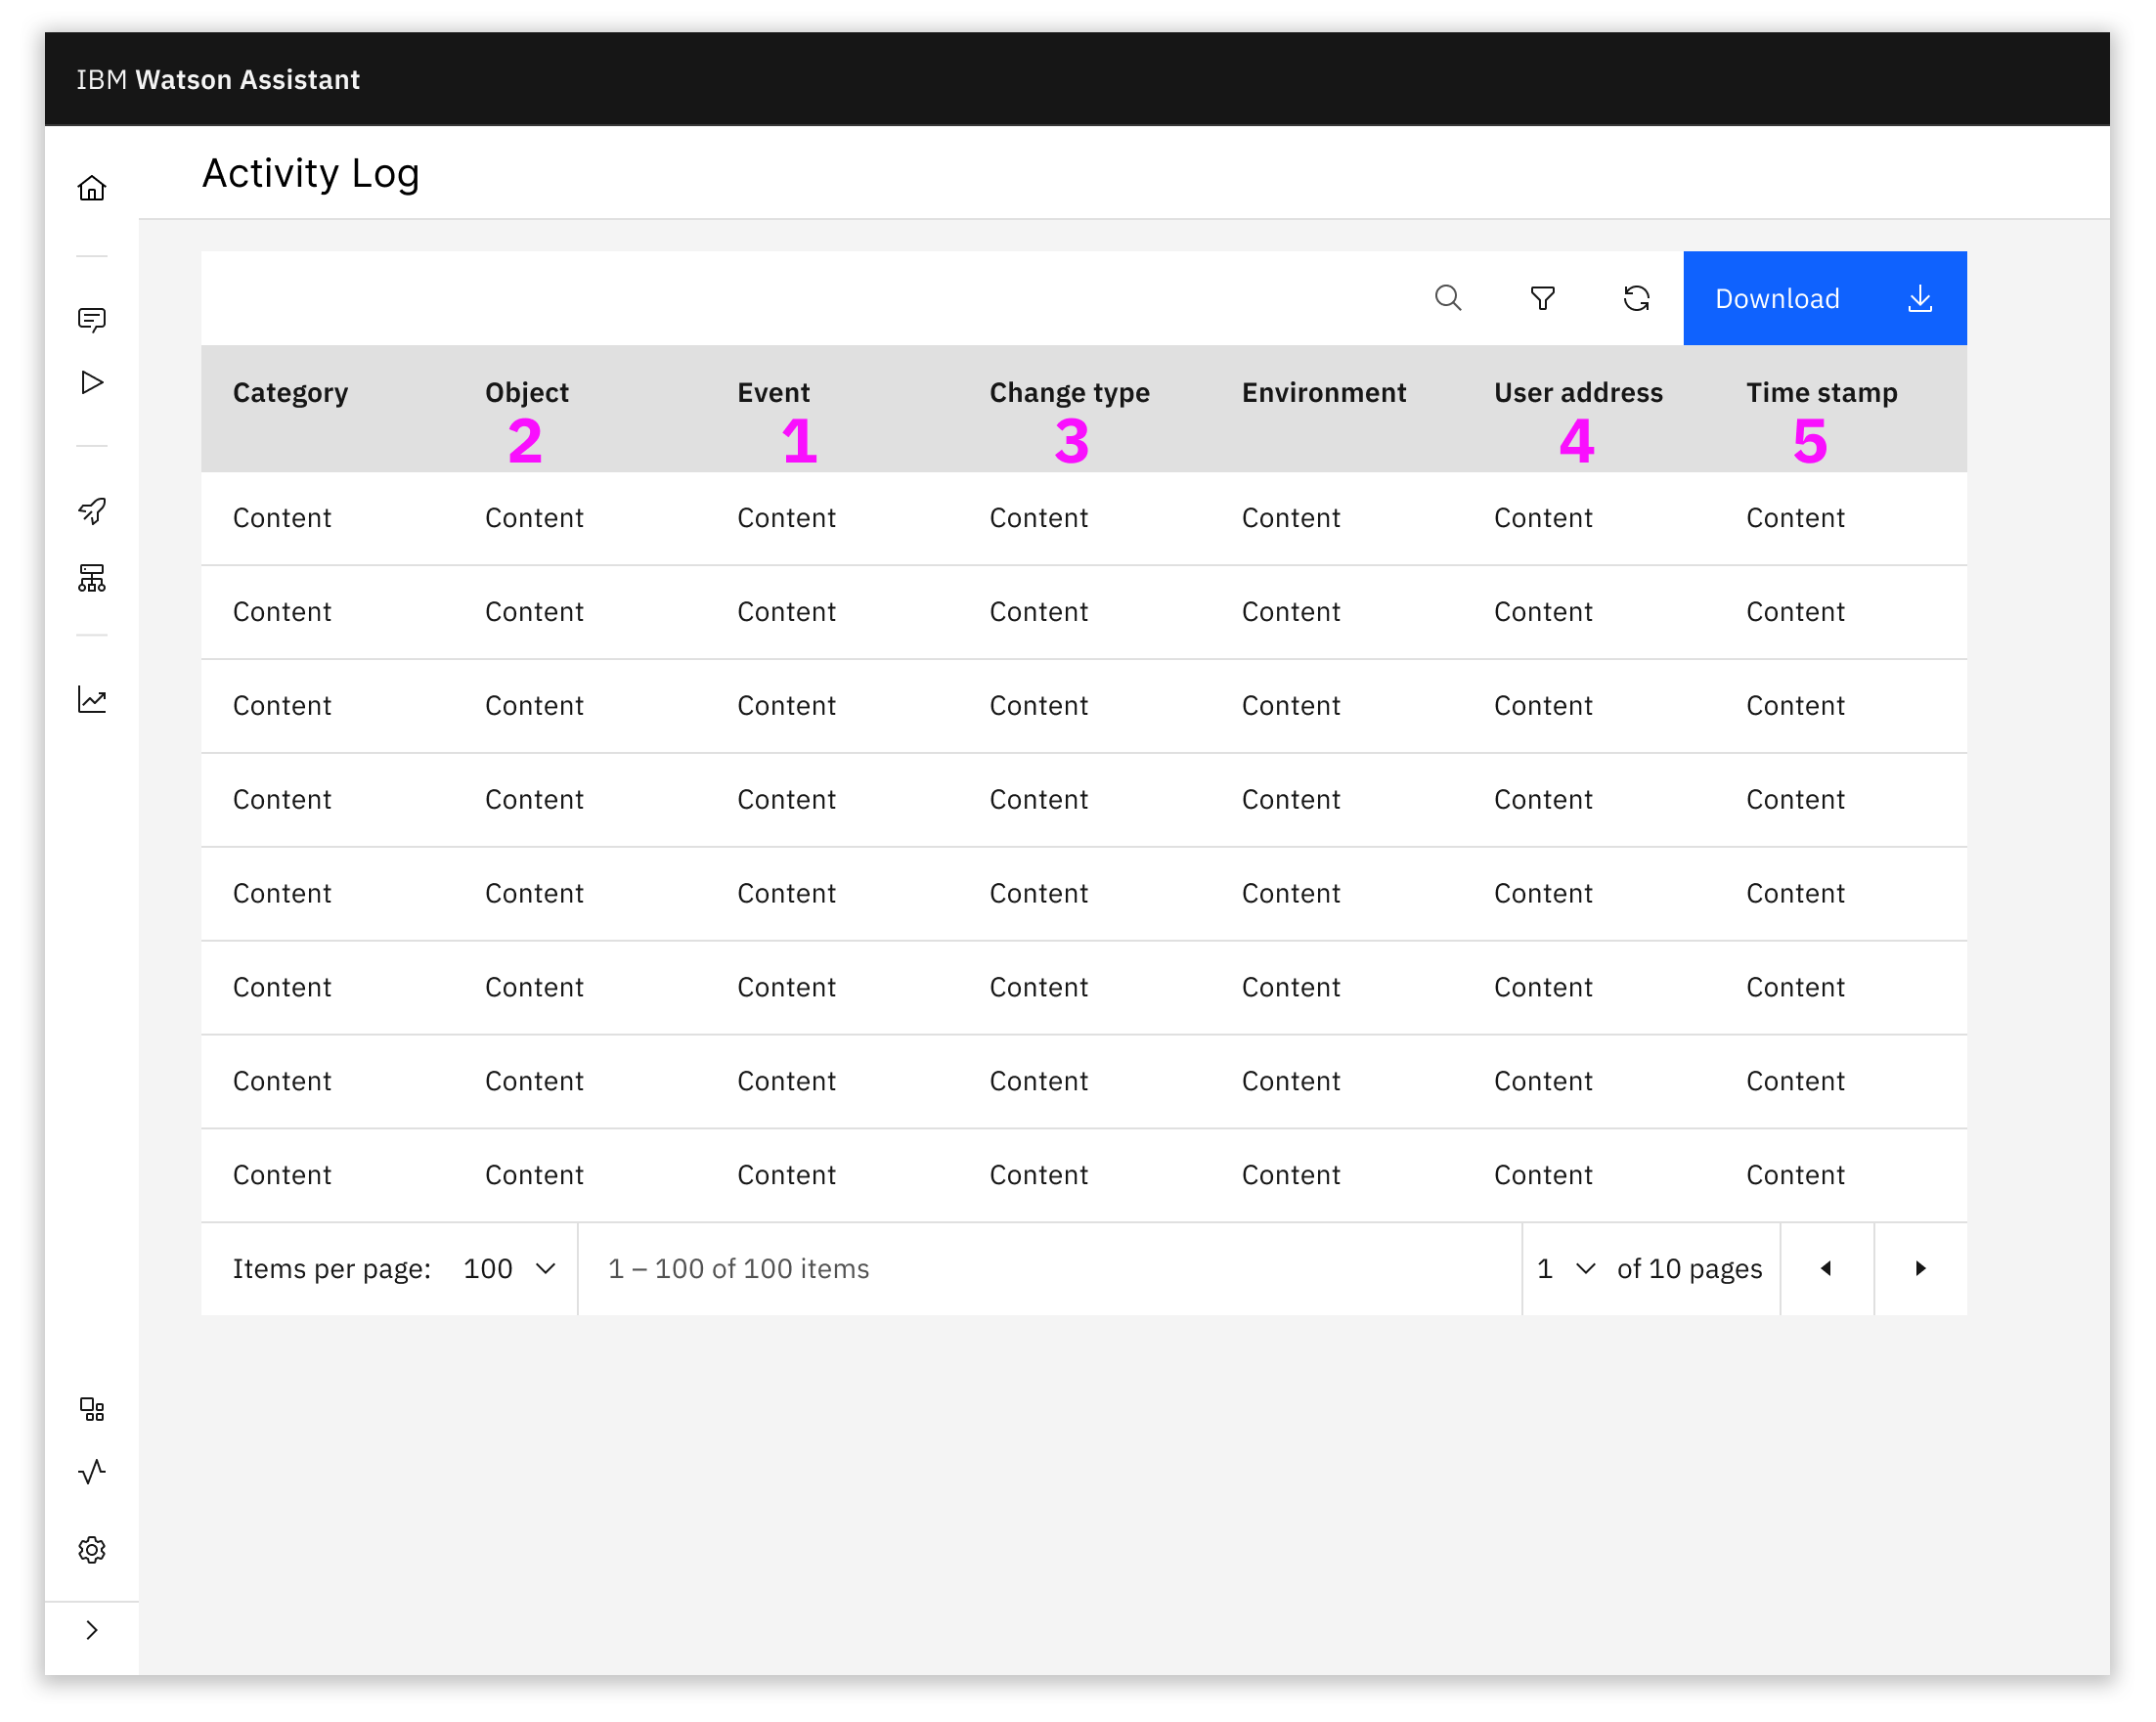
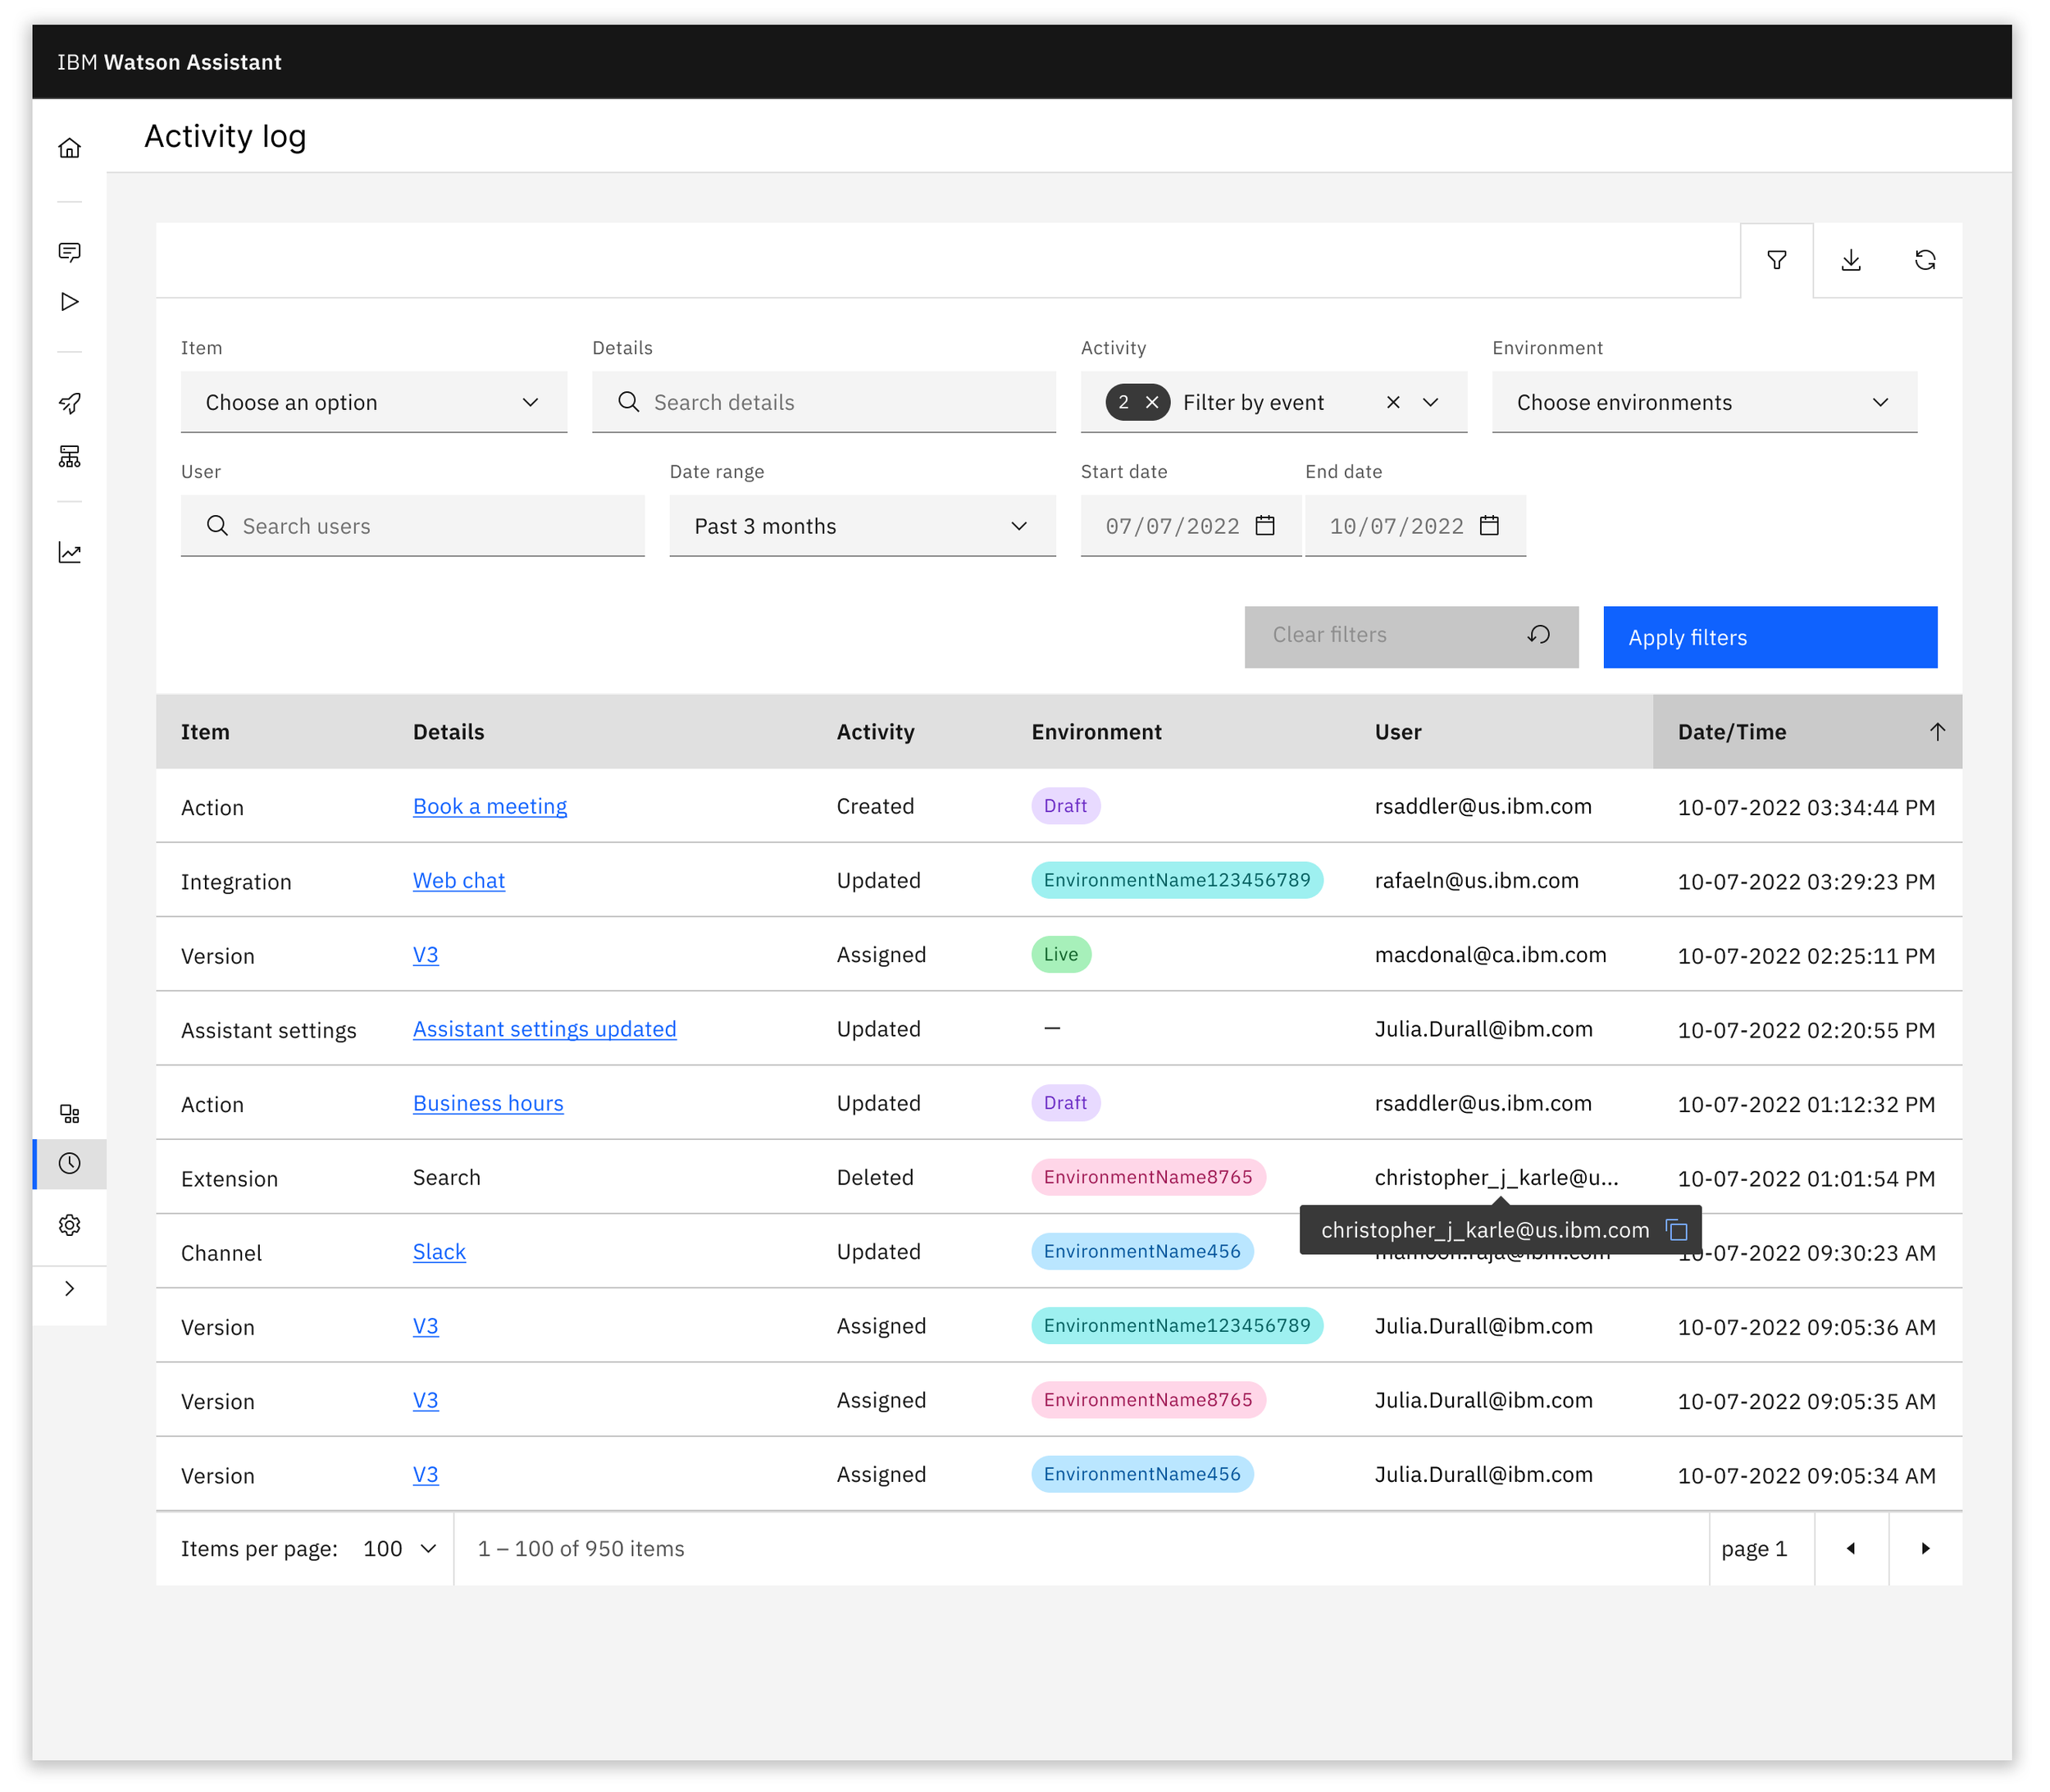
Hi-fi design, round 1:
The solution we delivered contained several key features, including:
New page in product focused on activity tracking
Activity log provided details of the type of change (i.e. create, revert, update, delete), where it took place, who made the change, and when it occurred
Advanced filtering enabled ease of use
Link to email of person who made changes sped up resolution of issues
Direct link to items that were changed
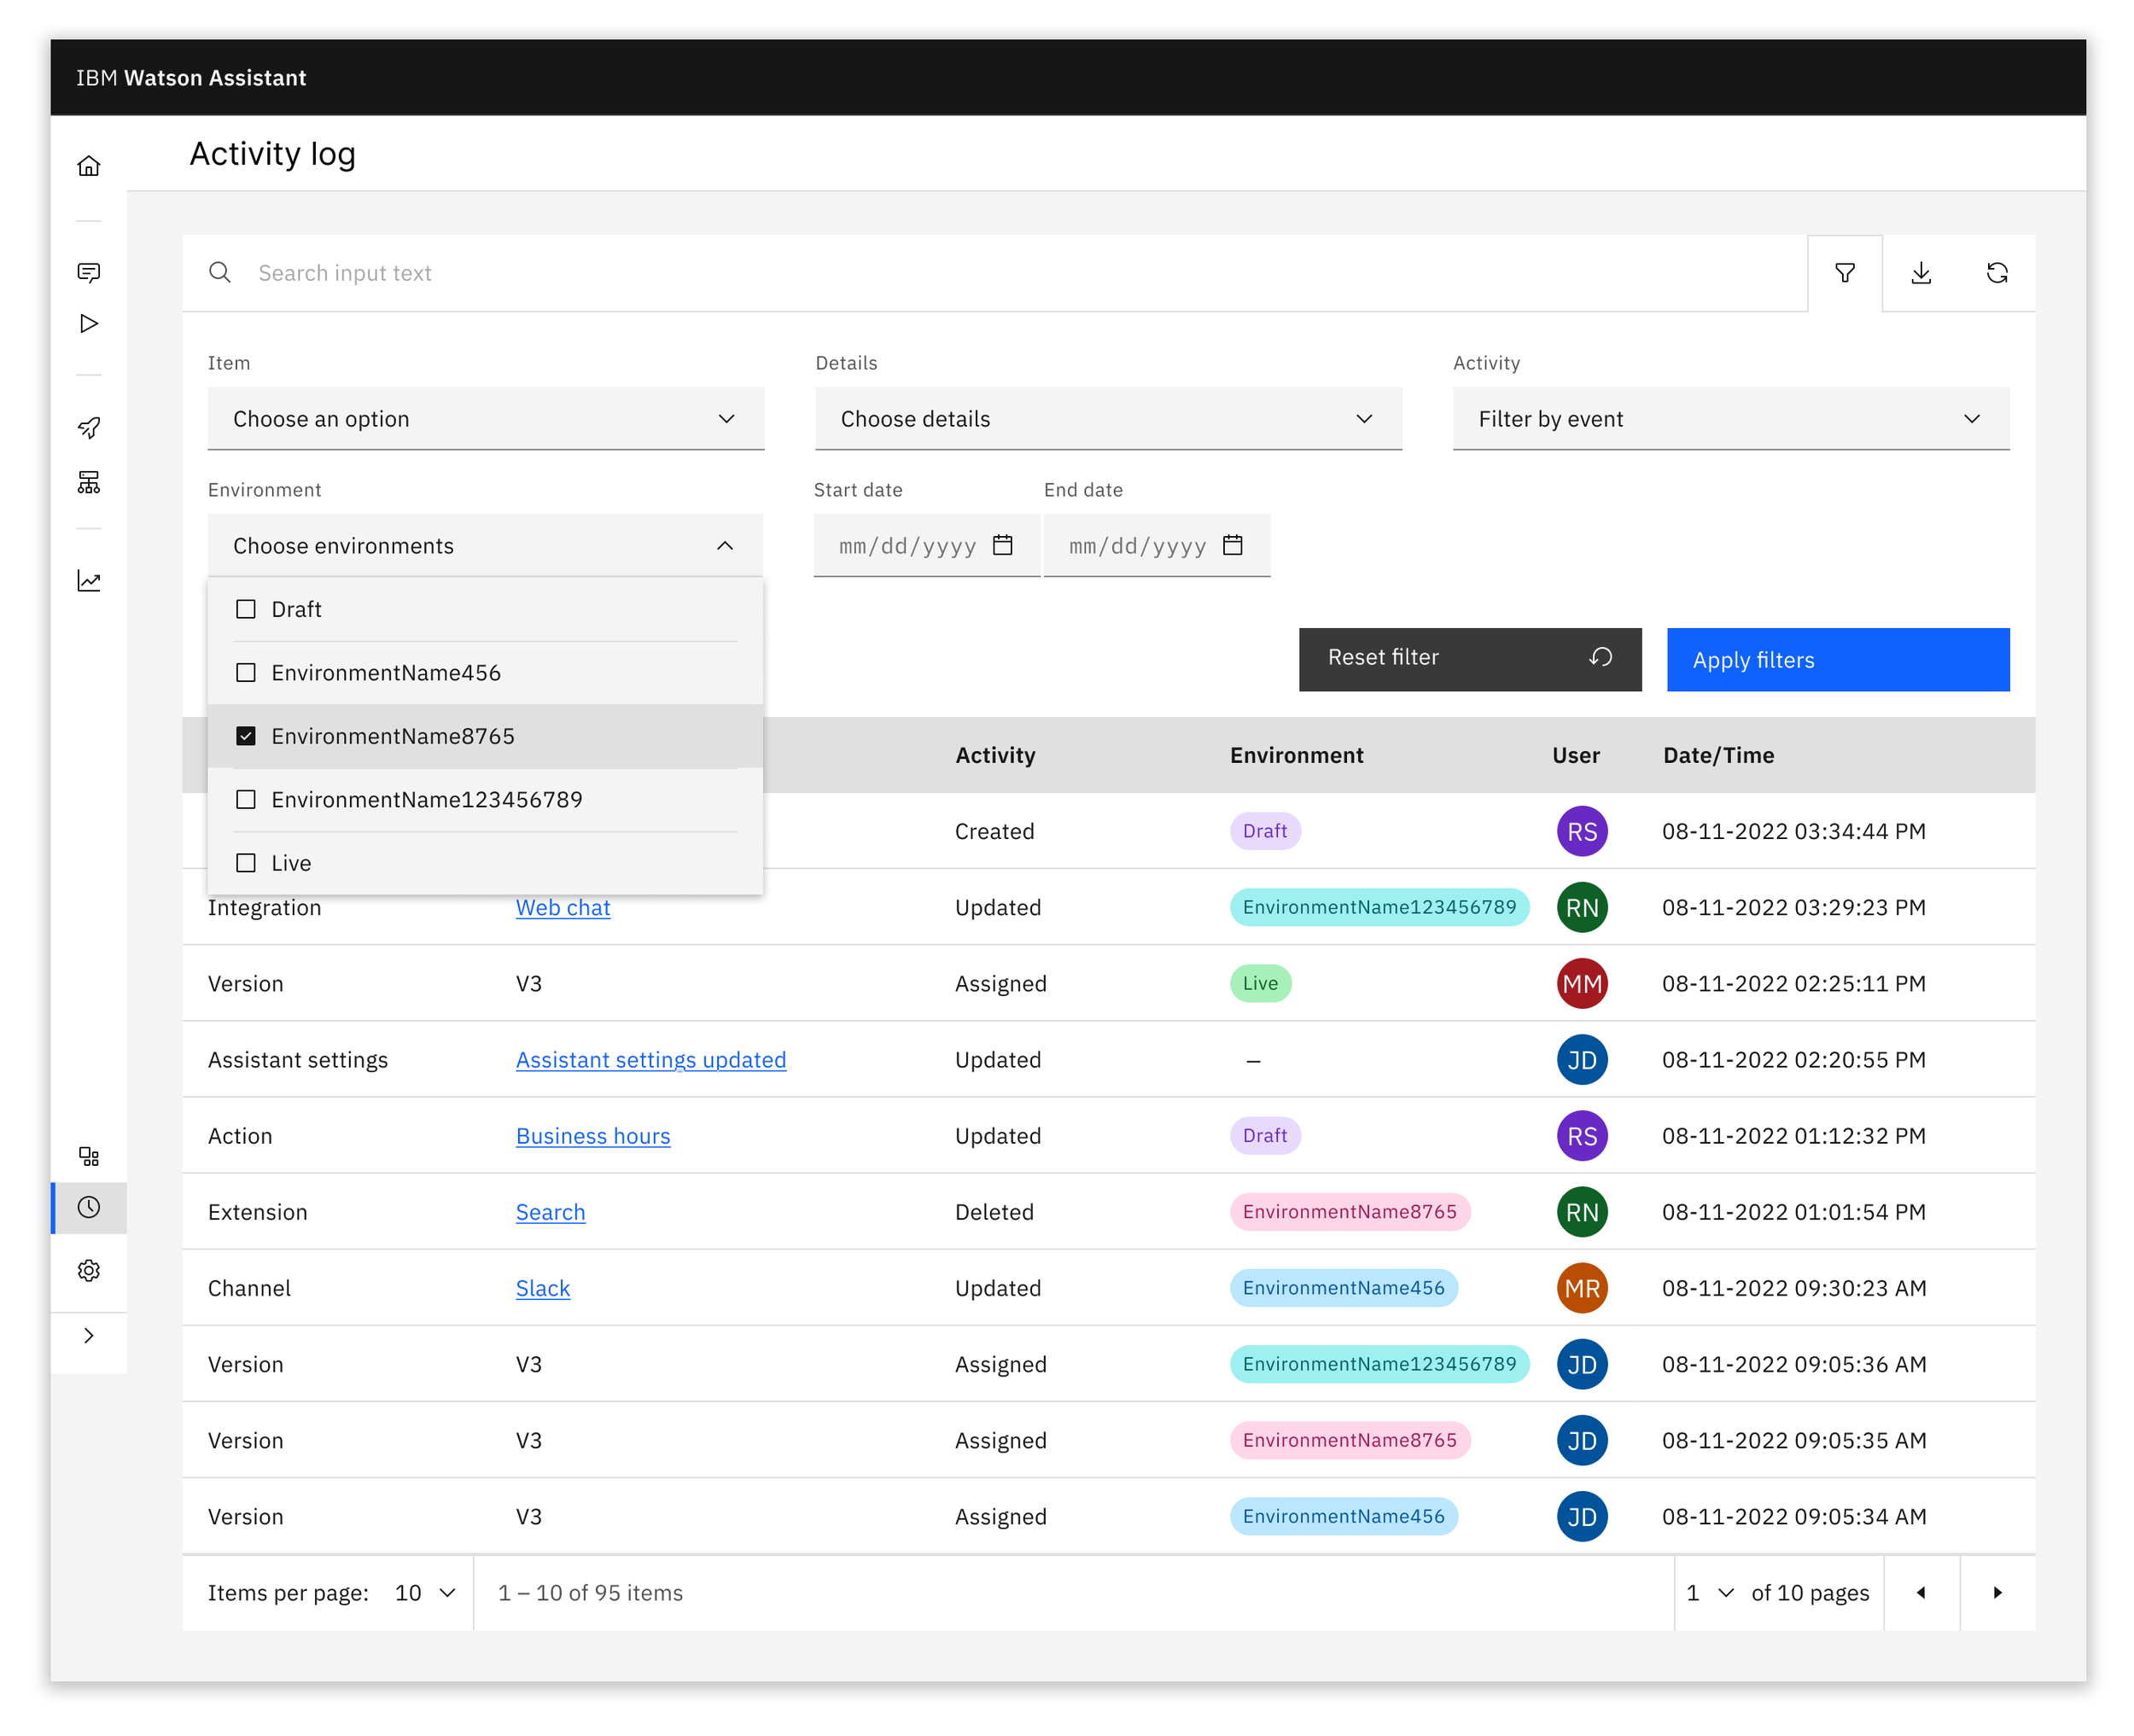
Hi-fi design, round 2:
Once our front-end developers began working on the implementation, it became clear that they couldn’t create icons for the user columns. Also, based on feedback we received from our customers, we added fields to the filter set for searching for users and providing a date range.
Delivery and Insights
See below for a demo of my prototype as presented to our broader product team. The feature was released in July of 2023, almost a year after our initial workshop took place.
Figma prototype of Watson Assistant Activity Log, by Julia Durall
Feedback received from customers
Customer requests have included:
Seeing more details about each activity
Show activities at a more granular level
More interactivity beyond filtering and sorting, such as integrating with other parts of the product
Ability to go directly to the place where the activity took place
Unfortunately, we were unable to prioritize any of these changes due to a change in direction for the product team, so the feature still has limited functionality. It works well, but there is certainly room for improvement.